How we created a revenue forecast for our freemium SaaS
The story of how we started tracking our KPIs and created a simple revenue forecast for our bootstrapped startup. Template included!
Filip and I are bootstrapping Tally, the simplest way to create forms, with a team of 2. We’re not trying to raise capital, so we don’t need financial projections for investors. But what we do need are ways to hold ourselves accountable.
Freemium SaaS revenue models are often complex, and many variables need to be taken into account. We’re by no means experts on this subject, this article just tells the story of how we started tracking our KPIs and created a simple revenue forecast that does the job for us.
Content table
Weekly goals
Tracking KPI's
Learning from our data
Creating a forecast
Industry benchmarks
Weekly goals
When Filip and I launched our first startup (Hotspot) we decided to join Startup School. Startup School is an 8-week online course on how to start a startup, with the help from Y combinator. They encourage you to submit weekly updates - a great way to maintain motivation and track your progress over time.
Each week you need to answer a fixed set of questions about the number of users you talked to, what you learned from them, your morale, and your goals for next week. You also keep track of a primary metric (MAU, MRR) and notes on what most improved your primary metric that week.
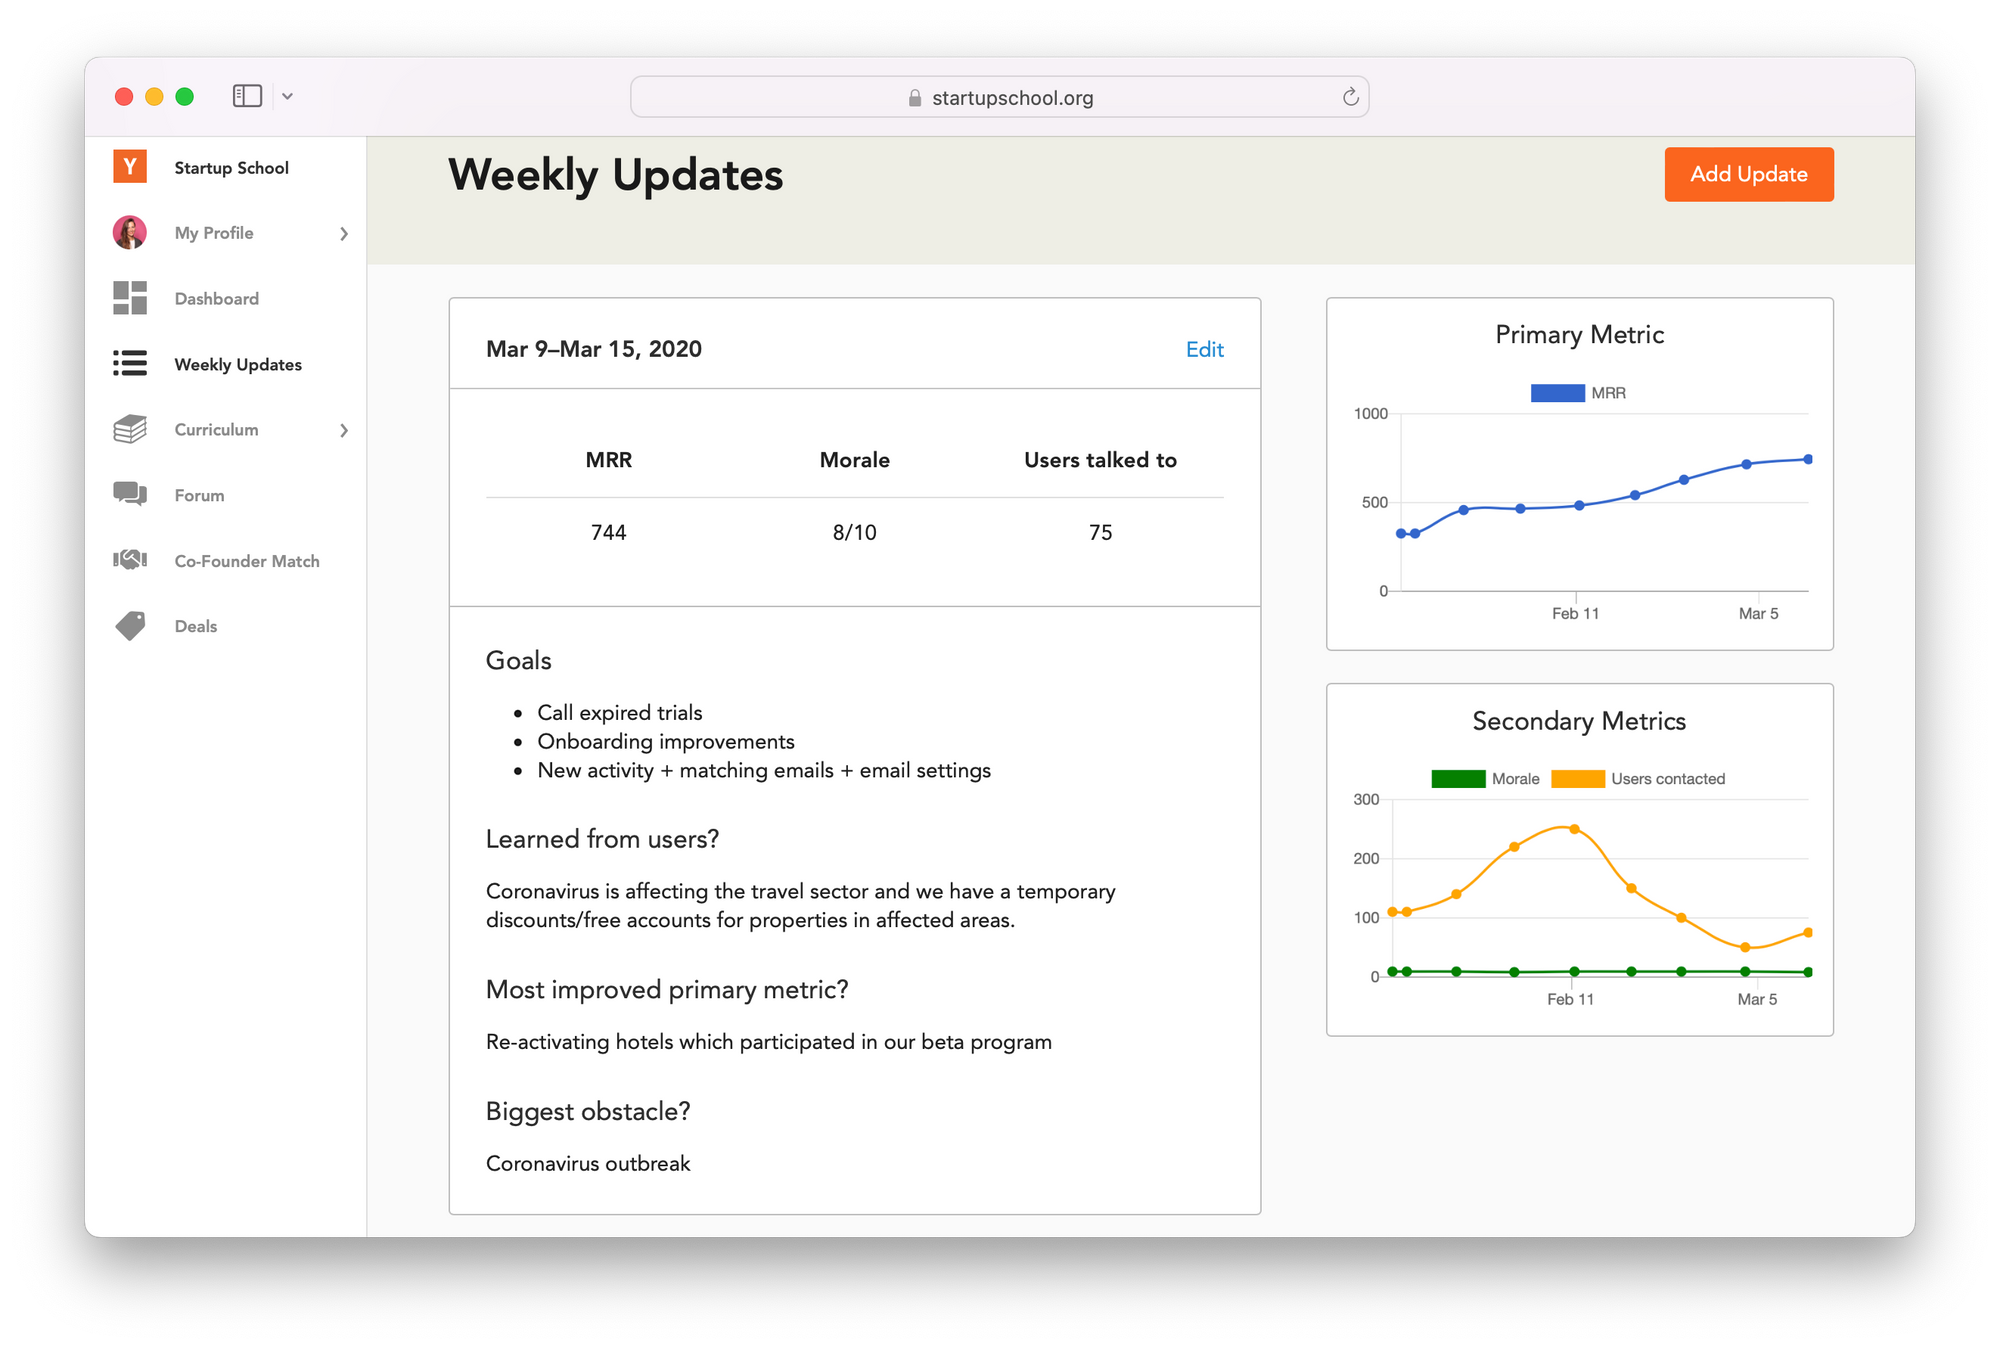
The weekly updates helped us a lot to hold ourselves accountable, which can be challenging when you have no one but yourself to report to.
Our startup died a quiet death, but the ritual of weekly updates made it into our next project, Tally.
Tracking KPI’s
A couple of months later we launched our new project Tally, and as befits a good student we started keeping track of our KPI’s in a Google Sheet. We decided to track:
- Total users
- New users per week
- MRR
- Total paying customers
- New paying customers per week
- Churned customers per week
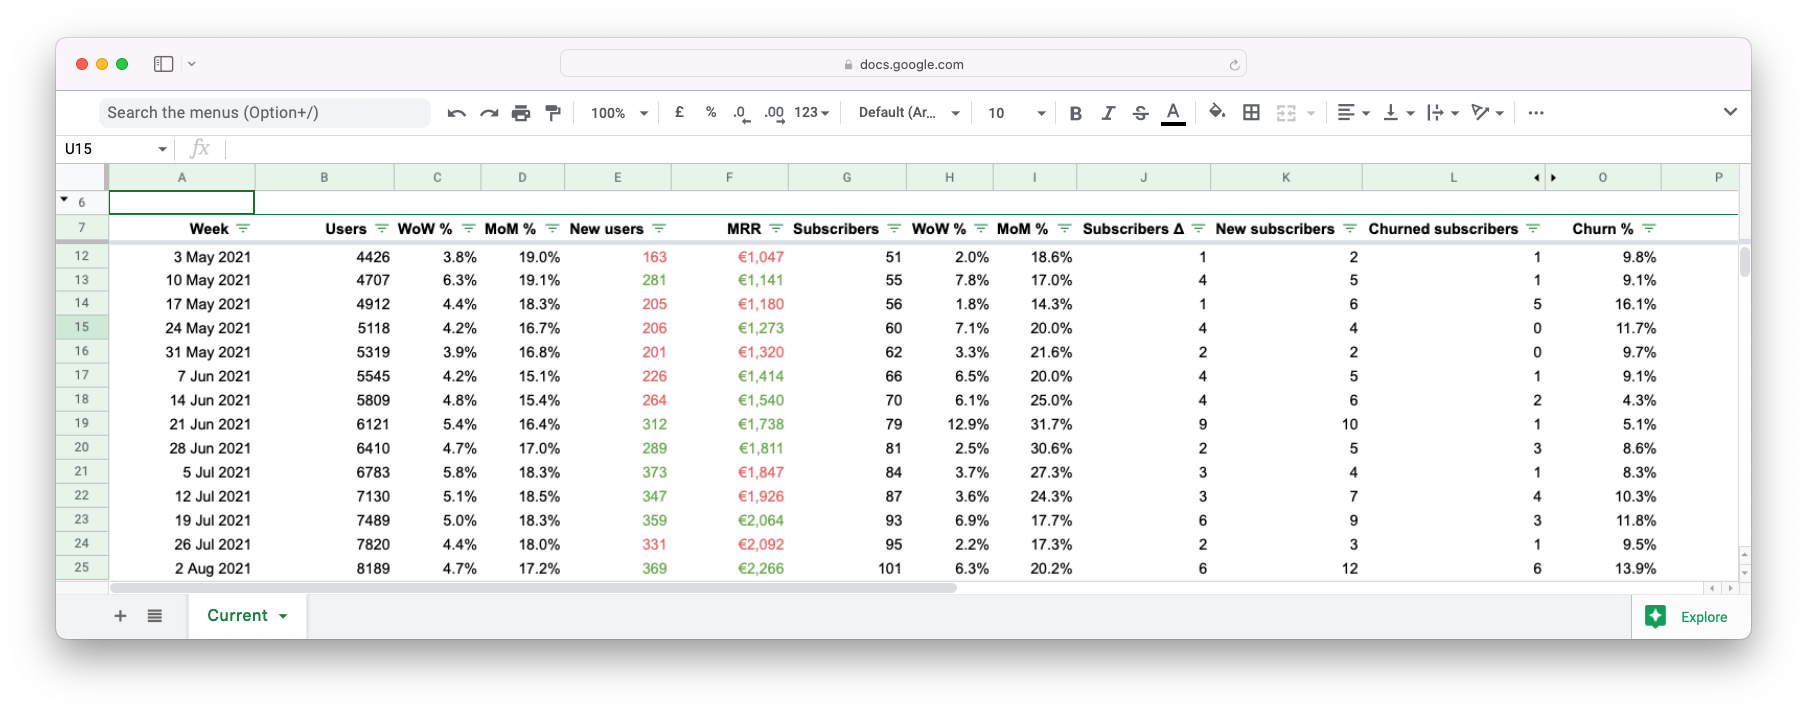
What this overview thought us is simply whether we did a better job than last week and if we are growing or not.
Learning from our data
We’re not trying to raise capital and we’ve been cash-flow positive from the start so we don’t need elaborate financial projections. Keeping track of our KPI s is simply helping us to get a realistic view of where we’re going and if our efforts are helping us get there.
However, every SaaS founder would like to able to answer these questions:
- How much money will my product generate?
- How much can we spend on marketing?
- When will we need to hire?
- How much can we pay ourselves?
After having gathered a couple weeks of data in our Google Sheet, we started playing around with variables that would help us forecast our growth. These were based on the growth and churn rates from our ‘historical’ data.
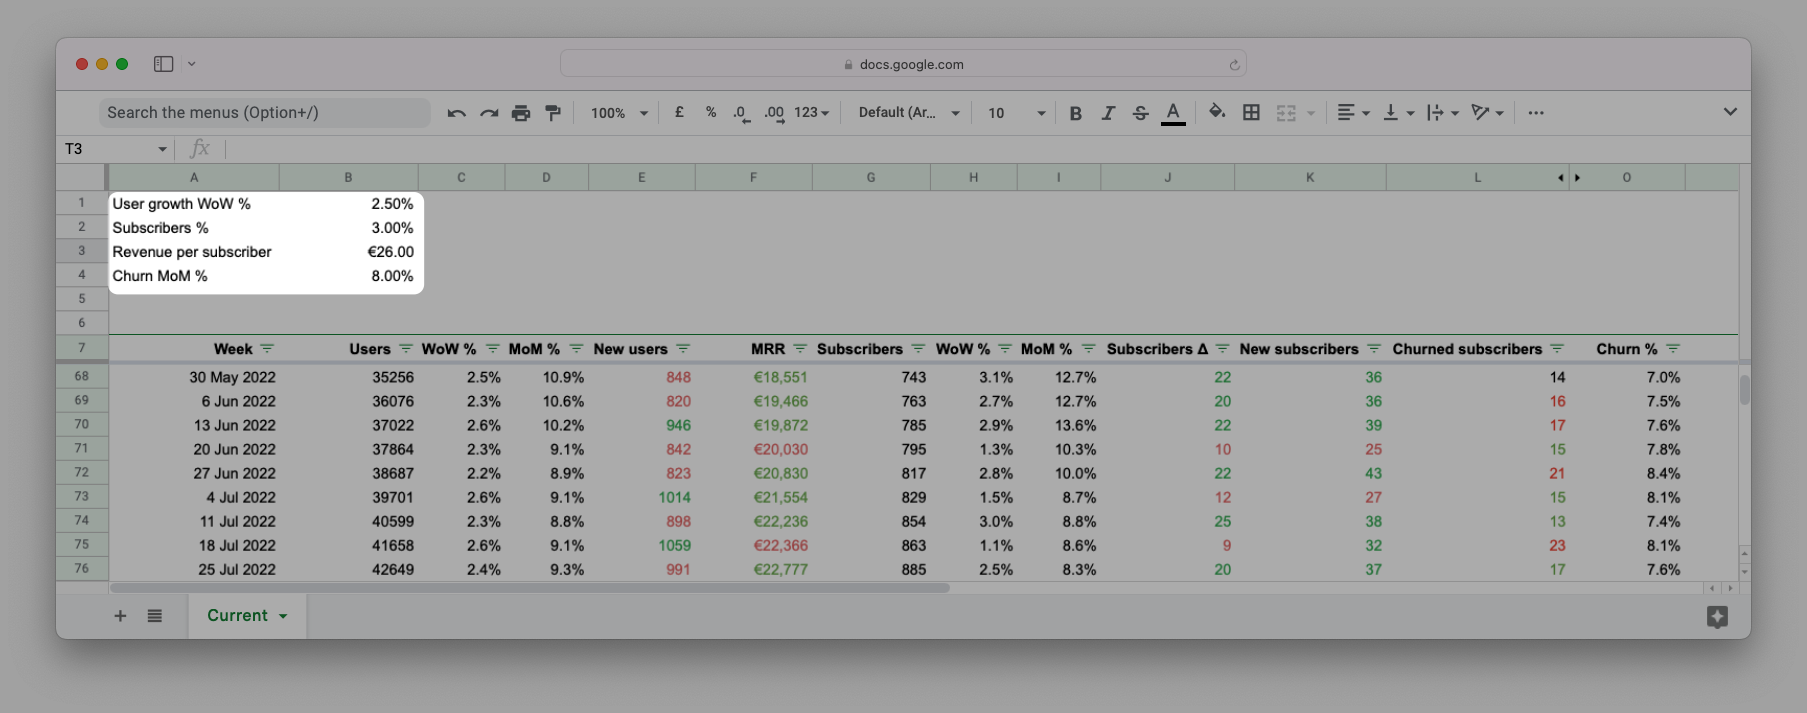
We update the following variables regularly based on fresh data from the latest weeks.
User growth WoW %: the percentage increase in users from last week.

Subscribers % : the percentage of users that upgrade and become subscribers (=paying customers)

Revenue per subscriber: the average monthly revenue (MRR) we make per subscriber.

Churn MoM %: the sum of the churned subscriptions in the past month divided by the number of active subscriptions*.

*1 month = 4 weeks in our template which is lower than the actual 4 weeks and 2 days in a month.
Creating a forecast
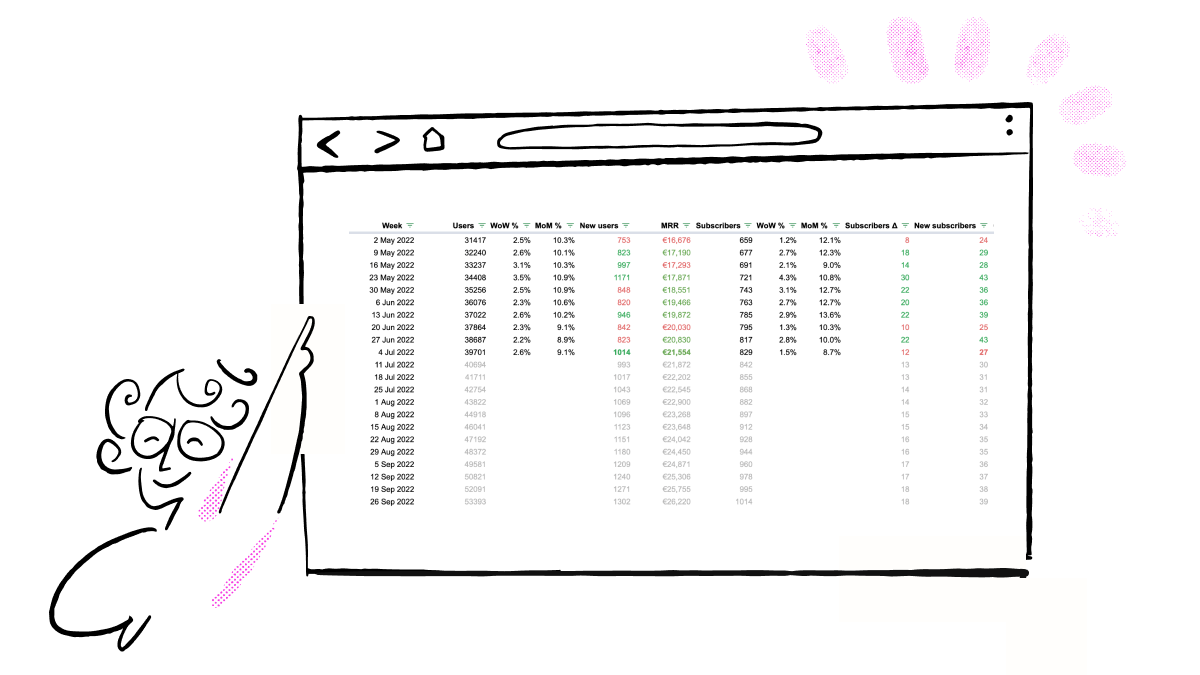
With the help of these variables we added a forecast to our Sheet and kept track of our progress week by week. We turned it into a template for you, you can grab it here.
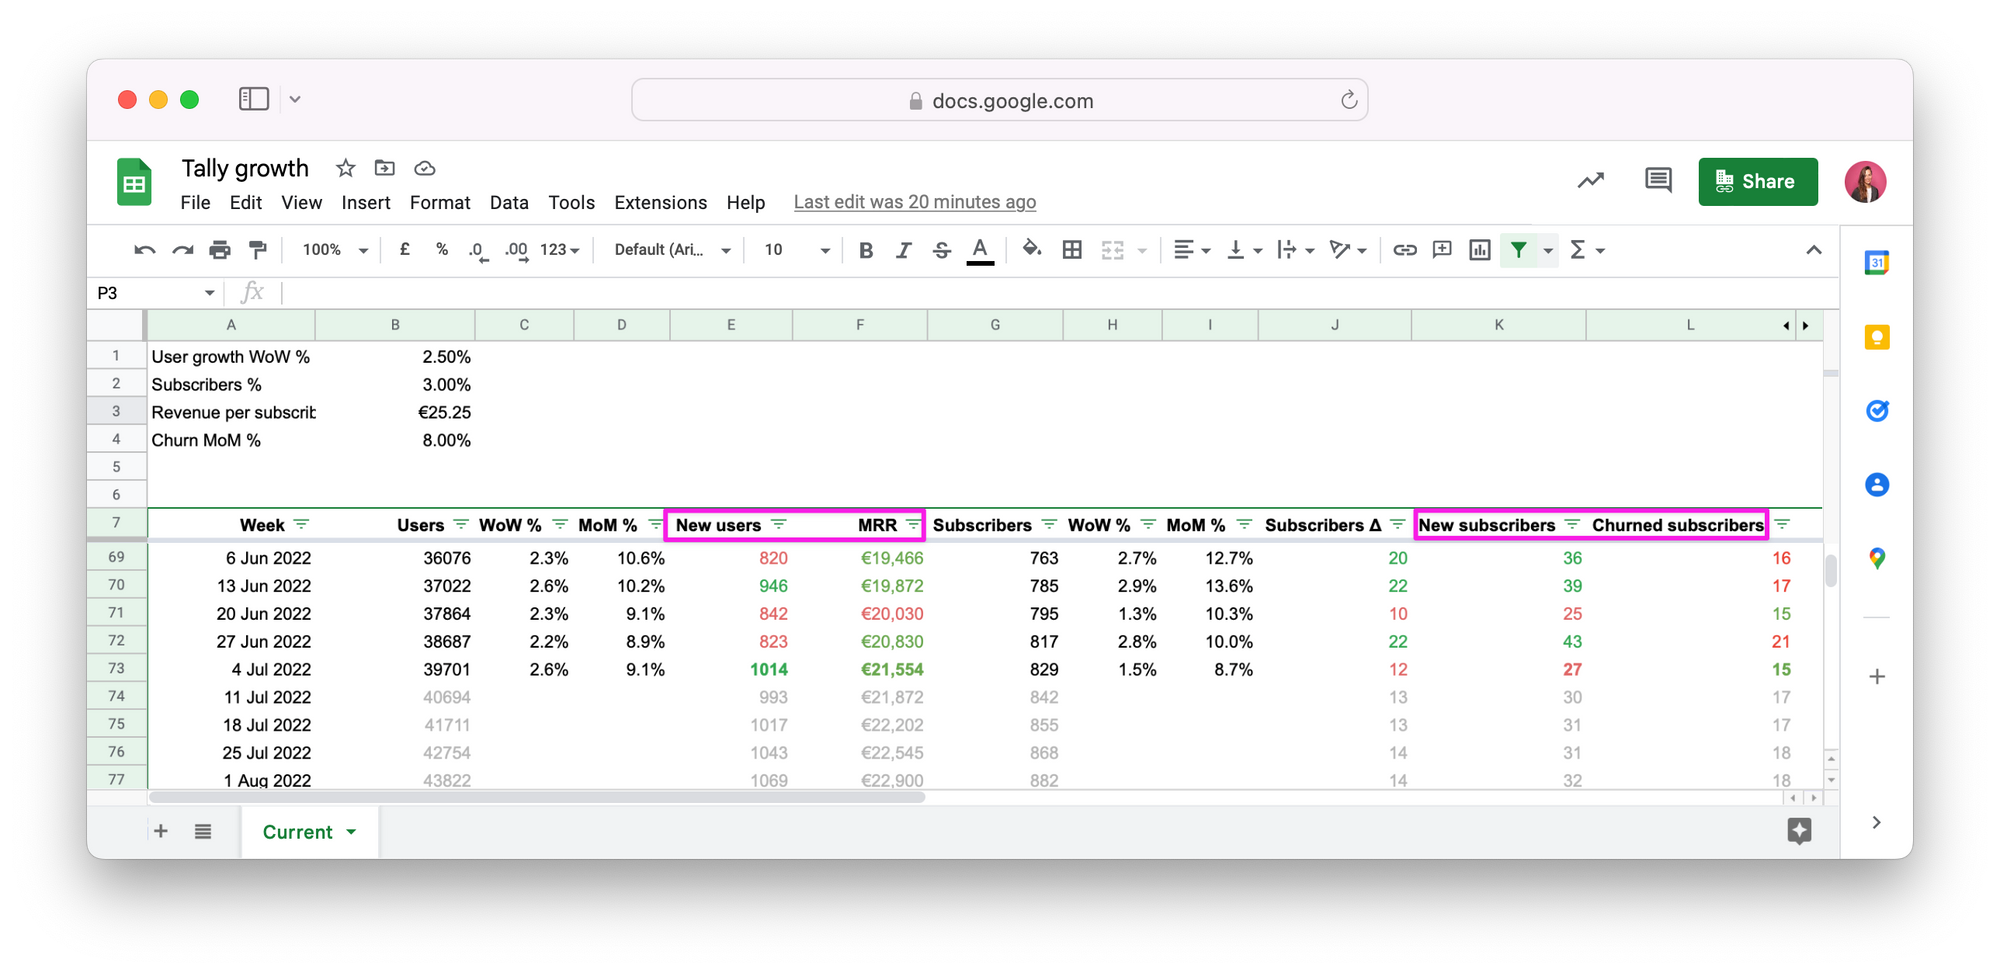
Every week we manually update these columns:
- New users
- MRR
- New subscribers
- Churned subscribers
The remaining columns will get automatically populated by the formulas in the template.
We also color code the MRR, new users and subscribers:
- Green: better than the forecast
- Black: same as the forecast
- Red: worse than the forecast
Every month, or whenever we notice new trends, we update the forecast variables to match the data of the past weeks.
Industry benchmarks
What a forecast based on our own historical data didn’t tell us is how we’re performing compared to the market. To get those insights we needed relevant industry benchmarks. It wasn’t easy to find relevant data about similar products (form builders), but we found a couple of resources that helped us learn about growth and churn rates in our industry.
This presentation by David Apple (former VP of Customer Success at Typeform) gave us some insights into the reasons why their customers churn, which are very similar to ours:
- Customers don’t live in our product
- A form builder is often used for 1-off projects
- We don’t have an enterprise offering with multi-year deals
This means our churn rate can be higher than the average 3-8% of other SaaS companies.
This article by ChartMogul shows the median compound monthly growth rate (CMGR) for SaaS startups split by monthly recurring revenue (MRR) range.